Drug Safety Data Source Calculator
Compare Real-World Evidence Sources
Calculate which data source (patient registries or claims data) is more effective for detecting specific drug safety signals based on population size and event rarity.
Number of patients in your study population
How common is the side effect? (e.g., 10000 = 1 in 10,000 patients)
%
How this works: Uses data from the article: Registries require 500k patients for rare events (vs. 1M+ for claims data) with 87% data completeness vs. 52% for claims.
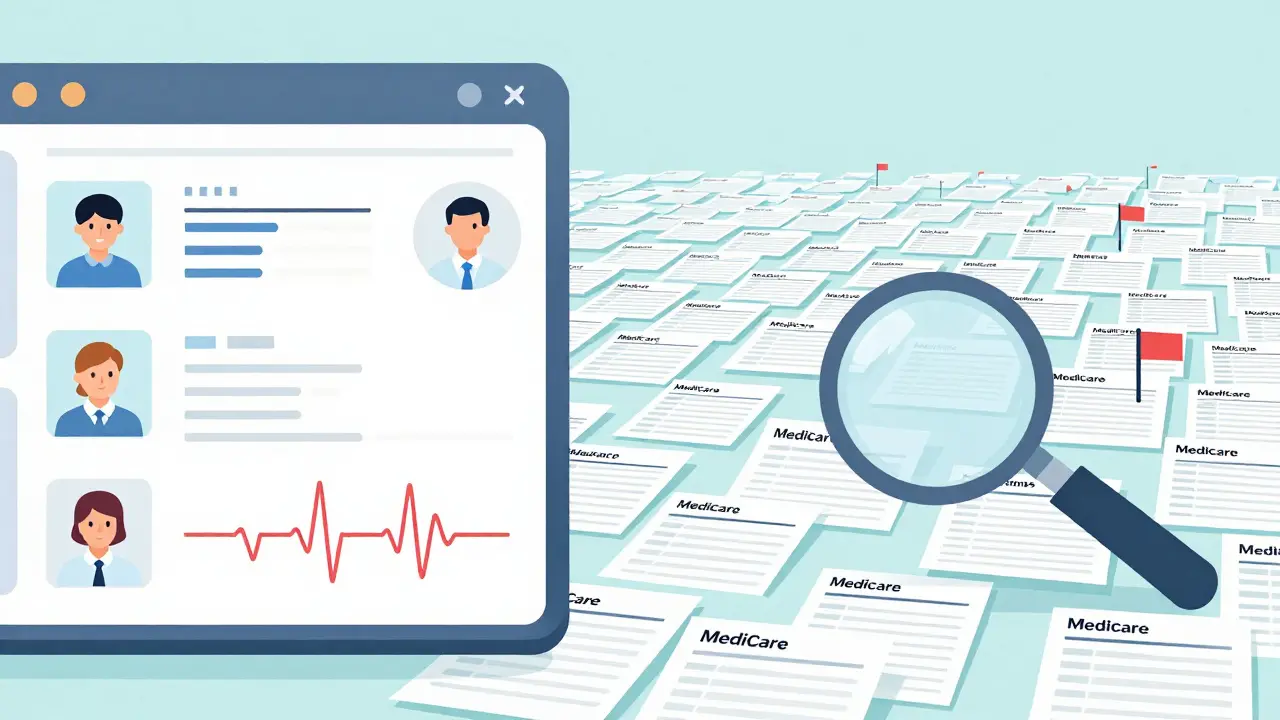
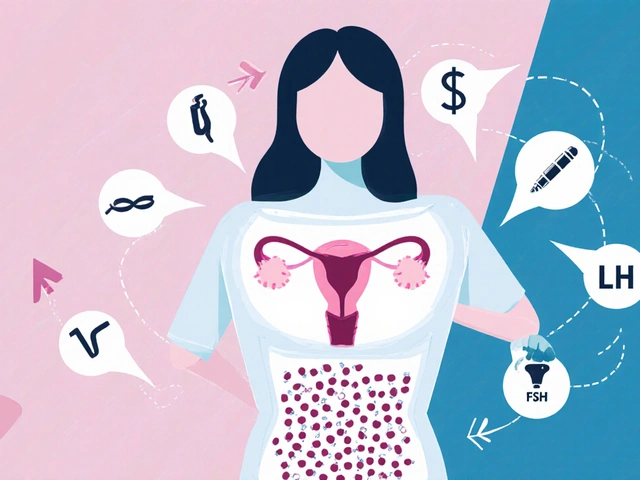
When a new drug hits the market, the clinical trial data tells you only part of the story. Trials involve thousands of patients-sometimes just a few hundred-and run for months, not years. But what happens when millions of people start taking that drug over decades? That’s where real-world evidence comes in. For drug safety, two of the most powerful sources are patient registries and claims data. Together, they help regulators, doctors, and pharmaceutical companies spot dangers that clinical trials missed.
What Real-World Evidence Actually Means
Real-world evidence (RWE) isn’t theoretical. It’s real data pulled from everyday healthcare systems. Think of it as the digital footprint of patient care: doctor visits, prescriptions filled, hospital stays, lab results, and even patient-reported symptoms. Unlike clinical trials, which control every variable, RWE captures how drugs behave in messy, real life-with all the comorbidities, different dosages, and lifestyle factors that trials can’t replicate. The U.S. Food and Drug Administration (FDA) started formally recognizing RWE in 2018. Since then, it’s been used in over a dozen drug approvals. In 2022 alone, the FDA reviewed 107 RWE submissions-up from just 29 in 2018. That’s not a trend. It’s a transformation.How Patient Registries Work
Patient registries are like detailed medical diaries for specific groups. They’re built around diseases (like cystic fibrosis or Parkinson’s) or specific drugs (like a new cancer therapy). Every entry includes more than just a diagnosis code. Registries track lab values, imaging results, side effects reported by patients, and even how well someone can walk or breathe over time. Take the Cystic Fibrosis Foundation Patient Registry. It’s tracked over 30,000 patients since the 1960s. When the drug ivacaftor was approved, clinical trials showed promise-but the registry spotted something else: patients with rare CFTR mutations had dramatic improvements. That detail never showed up in trials because those mutations were too uncommon. Registries found it. Registries aren’t perfect. They’re expensive to run. Setting one up costs between $1.2 million and $2.5 million and takes 18 to 24 months. Only 60-80% of eligible patients enroll, which can skew results. And about 35% of academic registries shut down within five years due to funding gaps. But their data quality? Unmatched. Registries capture 87% of lab values, compared to just 52% in claims data. For rare side effects-like a sudden heart rhythm change in 1 in 10,000 patients-registries need half the population size to detect the signal. That’s why they’re the gold standard for specialized populations.Claims Data: The Power of Scale
Claims data is the opposite of registries: less detail, but way more people. It’s what insurers and government programs like Medicare collect every time a doctor bills for a service. It includes diagnosis codes (ICD-10), procedures (CPT), and drug prescriptions (NDC codes). It doesn’t tell you someone’s blood pressure or whether they felt dizzy-but it does tell you they went to the ER three times in six months after starting a new medication. Medicare claims data alone covers 65 million Americans. Commercial databases like IBM MarketScan track over 200 million lives. That scale lets researchers spot rare events. In 2015, the FDA analyzed 1.2 million Medicare records to check if a Parkinson’s drug, entacapone, increased heart risks. No link found. In 2014, they used 850,000 records to assess olmesartan’s cardiovascular risks in diabetics. Again, no red flags. Claims data’s biggest strength is time. Medicare records go back 15+ years. Clinical trials rarely last longer than five. That’s why claims data is critical for spotting long-term risks-like bone fractures from osteoporosis drugs or liver damage from cholesterol meds that only show up after years of use. But it has blind spots. Only 45-60% of lab results are captured. Patient-reported symptoms? Almost never. Diagnosis codes are wrong 15-20% of the time, according to the Agency for Healthcare Research and Quality. And without clinical context, a spike in ER visits could mean anything: a side effect, a bad fall, or just a patient who hates their doctor.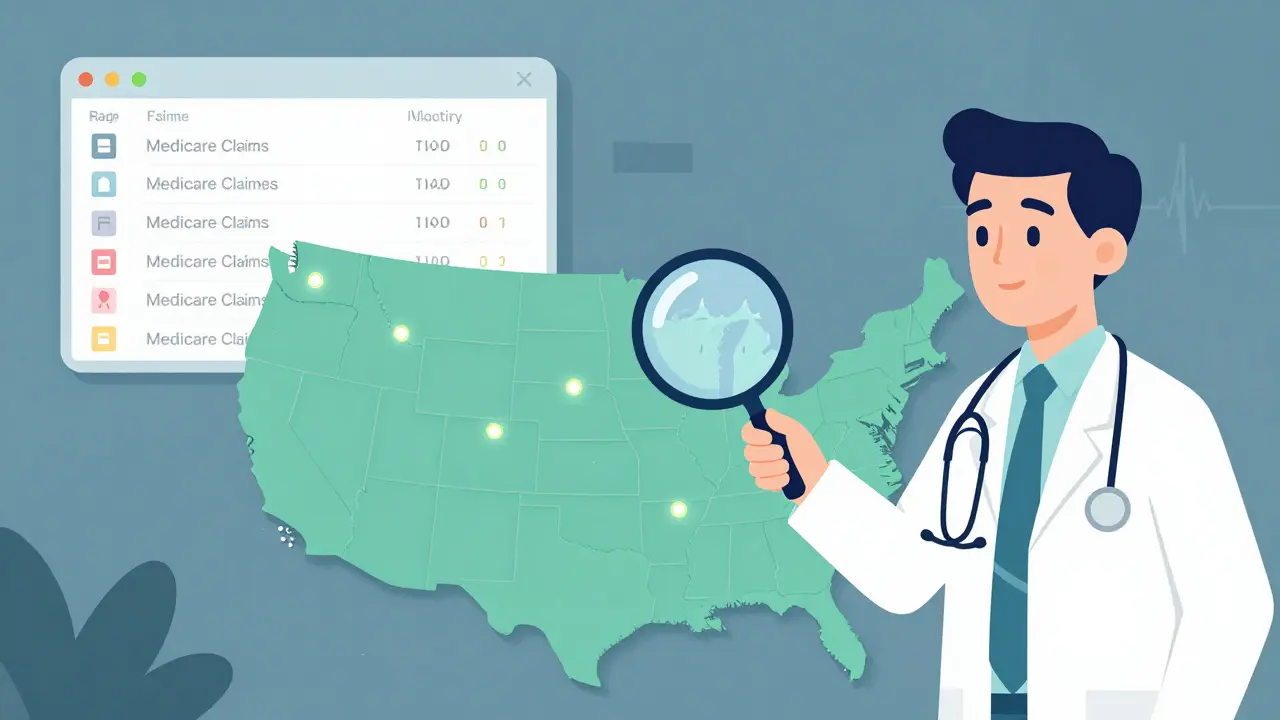
Registries vs. Claims Data: The Trade-Offs
Here’s the reality: neither source is enough on its own. | Feature | Registries | Claims Data | |---------|------------|-------------| | Population size | 1,000-50,000 patients | 100 million+ lives | | Clinical detail | High (labs, imaging, outcomes) | Low (mostly codes and billing) | | Data completeness (labs) | 87% | 52% | | Longitudinal coverage | 5-10 years (on average) | 15+ years (Medicare) | | Cost to maintain | $300K-$600K/year | Lower (uses existing billing systems) | | Detection power for rare events | 500,000 patients needed | 1 million+ patients needed | | Bias risk | Selection bias (voluntary enrollment) | Coding errors, missing symptoms | Registries are like a high-resolution MRI. You see every detail-but only of a small slice of the brain. Claims data is like a satellite image. You see the whole country, but you can’t tell if someone’s coughing or sweating. The FDA’s 2023 guidance says the best approach is combining both. A 2021 FDA methodology paper found that using both sources cuts false safety signals by 40%. For example, when the drug palbociclib got a new approval in 2019, the FDA didn’t rely on one source. They used claims data to find who was taking it, then checked registries to confirm whether those patients had the right cancer type and were getting proper monitoring.Why This Matters for Drug Safety
Drug safety isn’t just about preventing bad outcomes. It’s about avoiding overreactions. In 2022, a Yale study found that 22% of safety signals flagged by claims data alone turned out to be false positives. One case: a spike in kidney reports after a new blood pressure drug launched. Claims data showed a 30% increase. But when researchers checked registries, they found the patients were older, sicker, and already on multiple kidney-affecting drugs. The real culprit? Polypharmacy-not the new drug. Without registries, regulators might have pulled the drug. With both sources, they kept it on the market-and added clearer warnings for elderly patients. That’s the power of triangulation. Registries explain the “why.” Claims data shows the “how many.” Together, they turn noise into actionable insight.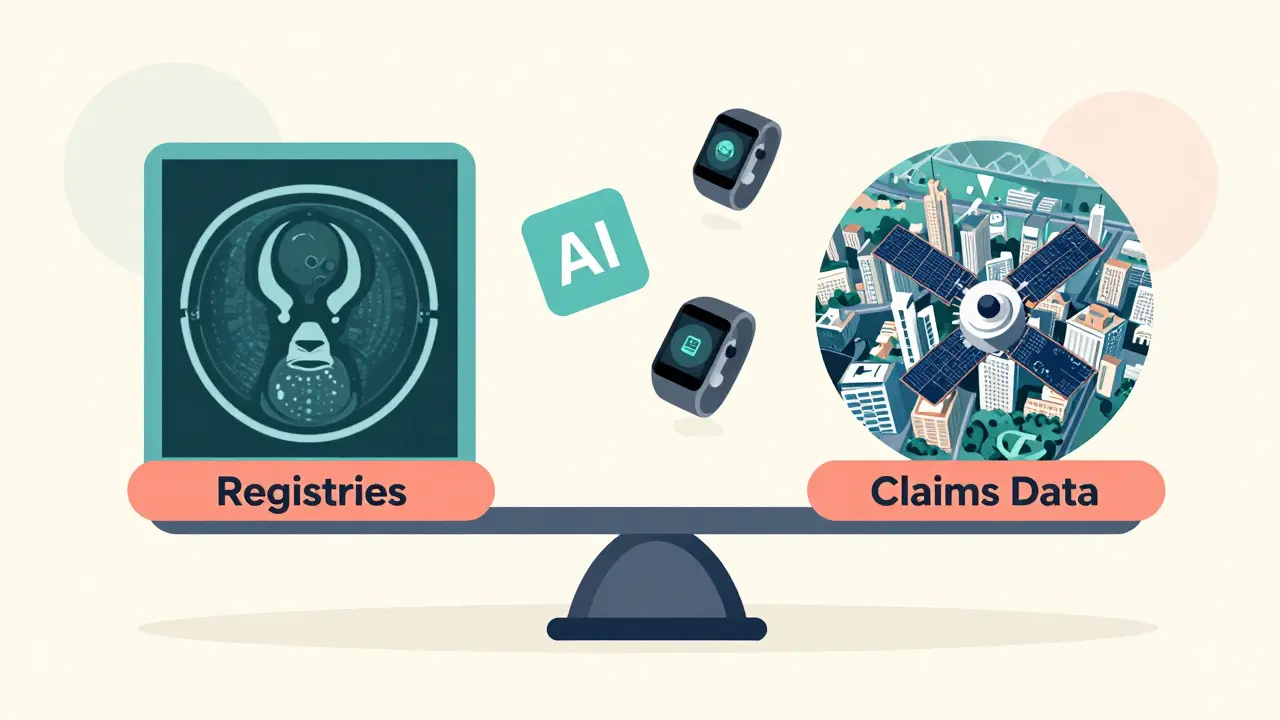

Sarah Mailloux
January 14, 2026 AT 15:08Finally someone gets it. I’ve seen so many docs panic over a spike in ER visits and pull a drug, only to find out it was just old folks on 12 meds. Real-world data isn’t perfect but it’s the only thing keeping us from throwing out good drugs over noise.
Also, registries are the unsung heroes. Nobody talks about them but they saved my sister’s life when they found ivacaftor worked for her rare mutation.
Jami Reynolds
January 14, 2026 AT 18:19Let’s be honest-this whole RWE movement is just Big Pharma’s way of dodging proper clinical trials. They’ve been pushing this ‘real-world’ nonsense since the 90s to avoid liability. Who’s really funding these registries? Who controls the data? And why is the FDA suddenly so cozy with pharma’s data vendors?
It’s not science-it’s surveillance dressed up as safety.
Frank Geurts
January 15, 2026 AT 23:47Allow me to offer a nuanced perspective, grounded in both empirical rigor and institutional history: the convergence of patient registries and claims data represents not merely an evolution in pharmacovigilance, but a paradigmatic shift in the epistemology of drug safety.
Whereas clinical trials operated under the Cartesian ideal of controlled variables, real-world evidence embraces the Heisenbergian reality of human complexity-where comorbidities, adherence patterns, and socioeconomic variables coalesce into a dynamic, non-linear system.
Moreover, the FDA’s 2023 guidance mandating 80% data completeness is not merely procedural-it is epistemologically necessary. Without such thresholds, the signal-to-noise ratio collapses into statistical chaos.
And let us not overlook the geopolitical dimension: Darwin EU’s 120-million-person network is not simply a database-it is a transnational social contract for public health sovereignty.
Thus, to dismiss RWE as ‘messy’ is to misunderstand the very nature of modern medicine: it is no longer a laboratory artifact, but a lived, data-rich experience.
Nishant Garg
January 17, 2026 AT 01:37Man, this post hit different. In India, we don’t even have half the data they’re talking about here. Most hospitals still use paper charts, and insurance? Ha. But I’ve seen doctors guess side effects based on nothing but patient stories.
Still, I get it-registries are like keeping a diary for your disease. And claims data? That’s the grocery receipt of healthcare. You know what you bought, but not if it was rotten.
Still, if we can get even 10% of our system to digitize like this, we’ll be lightyears ahead. Maybe one day, a kid in Delhi will get a drug saved by data from a registry in Ohio.
Nicholas Urmaza
January 17, 2026 AT 12:40If you’re still doubting RWE you’re either outdated or paid by Big Pharma. Clinical trials are a fairy tale. They test drugs on healthy young people who take their pills on time. Real people? They’re 70, on five meds, forget to refill, and drink grapefruit juice like it’s water.
Registries and claims data aren’t optional-they’re the only reason we’re not burying more people every year. Stop romanticizing trials. The future is real. Get with it.
Niki Van den Bossche
January 18, 2026 AT 11:31Oh darling, how quaint. You speak of ‘registries’ as if they’re some noble archive of human suffering, when in reality, they’re just another corporate surveillance tool wrapped in academic jargon.
And claims data? Please. It’s a graveyard of ICD-10 codes written by exhausted clerks who can’t spell ‘hypertension.’
But what’s truly tragic is how we’ve elevated data over dignity. We’ve turned patients into data points, their pain into a CSV file. And the FDA? They’re not protecting us-they’re optimizing for liability avoidance.
At least in the 1980s, we trusted doctors. Now? We trust algorithms written by interns at IBM.
How very… postmodern.
ellen adamina
January 19, 2026 AT 00:03I’ve been on a drug for 12 years and never knew my data was being used like this. It’s kind of comforting, honestly. Like someone’s watching out for me even when I’m not in the clinic.
Still, I wonder-do patients ever get to see what’s in their own registry? Or is it all locked behind corporate walls?
Gloria Montero Puertas
January 20, 2026 AT 06:01Ugh. Another ‘data is the future’ sermon. You know what’s really dangerous? When you let accountants and data scientists dictate medical decisions. Who cares if a drug ‘works’ in a spreadsheet if it makes people feel like zombies?
And don’t even get me started on ‘AI tools flagging patterns.’ Last week, an algorithm flagged my neighbor’s coffee intake as a ‘potential cardiac risk.’
Real safety isn’t in code. It’s in the quiet moments between a doctor and a patient. Not in a database.
Tom Doan
January 20, 2026 AT 17:05So let me get this straight. We’ve replaced clinical trials-rigorous, controlled, peer-reviewed-with insurance billing codes and volunteer diaries? And we call this ‘science’?
Next they’ll be using TikTok trends to approve insulin.
At least with trials, you knew the patients weren’t all on opioids and had their kidneys replaced by a 1998 Chevy.
But hey, if you want to gamble with human lives, go ahead. I’ll be over here, reading the original FDA white papers.
Annie Choi
January 22, 2026 AT 06:14Registries are the backbone of rare disease research. Without them, we’d have zero insight into conditions affecting 1 in 500,000. I work in biotech-we’ve got a registry for a metabolic disorder that’s saved 37 lives just by catching toxicity early.
Claims data? It’s the fire alarm. It tells you something’s burning. Registries tell you what’s on fire, why, and who’s still in the room.
Combine them? That’s not just best practice-it’s ethical imperatives.
Arjun Seth
January 24, 2026 AT 05:33This whole thing is a scam. People are dying because they’re on drugs that were approved based on lies. Registries? Who pays for them? Pharma. Claims data? Who owns it? Big Insurance. The FDA? They’re on the payroll.
Real safety? It’s not in databases. It’s in banning drugs before they’re sold. Not after 10,000 people turn into zombies.
Wake up. This isn’t progress. It’s corruption with a spreadsheet.
Mike Berrange
January 24, 2026 AT 05:48Interesting. But where’s the data on how often these registries are misused? Or how many false positives are ignored because ‘the signal looks plausible’?
Also, did anyone check if the 87% lab completeness in registries includes data that was manually entered by someone who just finished a 12-hour shift?
And why are we pretending this isn’t just a way to avoid Phase IV trials?
Just sayin’.
Dan Mack
January 26, 2026 AT 04:12They’re watching us. Every pill, every ER trip, every doctor’s note. They’re building a profile of every American. And when you get sick? They’ll know if you’re ‘high risk’ before you even walk in.
And guess what? Your insurance will deny you coverage because your ‘data footprint’ says you’re ‘likely to need expensive care.’
This isn’t safety. It’s social credit for your meds.
They’re not protecting you. They’re pricing you.
Amy Vickberg
January 26, 2026 AT 16:40I love how this post doesn’t just explain the tech-it explains why it matters. Real people, real lives, real side effects. We don’t need perfect data. We need honest data.
And if we can use this to keep more drugs on the market safely? That’s a win. Let’s build more registries. Let’s fix the coding. Let’s not throw out the baby with the bathwater.
Ayush Pareek
January 27, 2026 AT 10:05Big picture: this isn’t about tech. It’s about trust. Patients need to know their stories aren’t just numbers. Doctors need to know their notes aren’t ignored. Registries give voice. Claims give scale. Together, they make safety real.
Don’t fear the data. Use it. Improve it. Make it fair.
And if you’re in pharma? Stop treating patients like variables. Treat them like people.